Architecture school rankings
Architecture program rankings by average architecture licensure exam division pass rates (undergraduate programs)
Composite average pass rates for schools offering an NAAB-accredited BArch degree
Rank School
Pass Rate
University of Notre Dame
77%
2 University of Oregon
72%
3 Virginia Tech
71%
4 Carnegie Mellon University
70%
5 Rice University
69%
6 Tulane University
69%
7 University of Texas at Austin
69%
8 Penn State
67%
9 University of Tennessee
66%
10 North Carolina State University
65%
11 Cornell University
64%
12 Ball State University
63%
13 Auburn University
62%
14 Mississippi State University
62%
15 Oklahoma State University
62%
16 Iowa State University
62%
17 Louisiana State University
62%
18 University of North Carolina at Charlotte
62%
19 Marywood University
61%
20 Cal Poly San Luis Obispo
61%
21 Rensselaer Polytechnic Institute
61%
22 University of Arkansas
60%
23 Drexel University
59%
24 Drury University
58%
25 Syracuse University
58%
26 University of Maryland
58%
27 Rhode Island School of Design
57%
28 University of Arizona
57%
29 National Average
55%
30 University of Southern California
53%
31 Boston Architectural College
52%
32 Illinois Institute of Technology
52%
33 University of Louisiana at Lafayette
52%
34 University of Miami
50%
35 University of Oklahoma
50%
36 California College of the Arts
48%
37 New Jersey Institute of Technology
47%
38 Pratt Institute
47%
39 Kennesaw State University
46%
40 Cal State Pomona
45%
41 New School of Architecture and Design
45%
42 Southern California Institute of Architecture
43%
43 University of Houston
43%
44 Florida A&M
42%
45 The City College of New York
41%
46 Academy of Art University
39%
47 New York Institute of Technology
37%
48 Woodbury University
32%
49 Florida Atlantic University
31%
| School | Pass Rate | |
|---|---|---|
| University of Notre Dame | 77% | |
| University of Oregon | 72% | |
| Virginia Tech | 71% | |
| Carnegie Mellon University | 70% | |
| Rice University | 69% | |
| Tulane University | 69% | |
| University of Texas at Austin | 69% | |
| Penn State | 67% | |
| University of Tennessee | 66% | |
| North Carolina State University | 65% | |
| Cornell University | 64% | |
| Ball State University | 63% | |
| Auburn University | 62% | |
| Mississippi State University | 62% | |
| Oklahoma State University | 62% | |
| Iowa State University | 62% | |
| Louisiana State University | 62% | |
| University of North Carolina at Charlotte | 62% | |
| Marywood University | 61% | |
| Cal Poly San Luis Obispo | 61% | |
| Rensselaer Polytechnic Institute | 61% | |
| University of Arkansas | 60% | |
| Drexel University | 59% | |
| Drury University | 58% | |
| Syracuse University | 58% | |
| University of Maryland | 58% | |
| Rhode Island School of Design | 57% | |
| University of Arizona | 57% | |
| National Average | 55% | |
| University of Southern California | 53% | |
| Boston Architectural College | 52% | |
| Illinois Institute of Technology | 52% | |
| University of Louisiana at Lafayette | 52% | |
| University of Miami | 50% | |
| University of Oklahoma | 50% | |
| California College of the Arts | 48% | |
| New Jersey Institute of Technology | 47% | |
| Pratt Institute | 47% | |
| Kennesaw State University | 46% | |
| Cal State Pomona | 45% | |
| New School of Architecture and Design | 45% | |
| Southern California Institute of Architecture | 43% | |
| University of Houston | 43% | |
| Florida A&M | 42% | |
| The City College of New York | 41% | |
| Academy of Art University | 39% | |
| New York Institute of Technology | 37% | |
| Woodbury University | 32% | |
| Florida Atlantic University | 31% |
Architecture program rankings by average architecture licensure exam division pass rates (graduate school)
Composite average pass rates for schools offering an NAAB-accredited MArch degree
Rank School
Pass Rate
1 Princeton University
81%
2 University of Notre Dame
77%
3 University of Virginia
77%
4 Yale University
77%
5 MIT
73%
6 University of Washington
73%
7 University of Oregon
72%
8 Harvard University
72%
9 Virginia Tech
71%
10 Kent State University
71%
11 University Massachusetts Amherst
71%
12 Carnegie Mellon University
70%
13 Norwich University
70%
14 Portland State University
70%
15 University of Hartford
70%
16 University of Minnesota
70%
17 Rice University
69%
18 Tulane University
69%
19 University of Texas at Austin
69%
20 University of Cincinnati
69%
21 Judson University
68%
22 Montana State University
68%
23 Penn State
67%
24 Northeastern University
67%
25 University of Tennessee
66%
26 University of Colorado, Denver
66%
27 North Carolina State University
65%
28 Clemson University
65%
29 Ohio State University
65%
30 University of California, Berkeley
65%
31 University of Nebraska-Lincoln
65%
32 Cornell University
64%
33 Miami University
64%
34 Roger Williams University
64%
35 University of Colorado
64%
36 Washington State University
64%
37 Ball State University
63%
38 Texas A & M University
63%
39 University of Kansas
63%
40 University of Wisconsin-Milwaukee
63%
41 Iowa State University
62%
42 Louisiana State University
62%
43 University of North Carolina at Charlotte
62%
44 University at Buffalo, SUNY
62%
45 University of Illinois, Urbana-Champaign
62%
46 University of Michigan
62%
47 Cal Poly San Luis Obispo
61%
48 Rensselaer Polytechnic Institute
61%
49 Columbia University
61%
50 Kansas State University
61%
51 North Dakota State University
61%
52 University of Kentucky
61%
53 University of Idaho
60%
54 University of Utah
59%
55 Drury University
58%
56 Syracuse University
58%
57 University of Maryland
58%
58 Georgia Tech
58%
59 Washington University in St.Louis
58%
60 Rhode Island School of Design
57%
61 University of Arizona
57%
62 Lawrence Technological University
57%
63 University of California, Los Angeles
57%
64 University of Pennsylvania
57%
65 Catholic University
56%
66 University of Illinois at Chicago
56%
67 National Average
55%
68 University of Detroit - Mercy
55%
69 Wentworth Institute of Technology
55%
70 Frank Lloyd Wright School of Architecture
54%
71 School of Art Institute of Chicago
54%
72 Southern Illinois University Carbondale
54%
73 Temple University
54%
74 University of Southern California
53%
75 University of New Mexico
53%
76 Boston Architectural College
52%
77 Illinois Institute of Technology
52%
78 University of Louisiana at Lafayette
52%
79 Philadelphia University
52%
80 Andrews University
51%
81 Morgan State University
51%
82 University of Florida
51%
83 University of Miami
50%
84 University of Oklahoma
50%
85 Louisiana Tech University
49%
86 Texas Tech University
49%
87 California College of the Arts
48%
88 Arizona State University
48%
89 University of Hawaii at Manoa
48%
90 New Jersey Institute of Technology
47%
91 Pratt Institute
47%
92 Savannah College of Art and Design
47%
93 Cal State Pomona
45%
94 New School of Architecture and Design
45%
95 Southern Polytechnic State University
45%
96 University of South Florida
45%
97 University of Texas at Arlington
45%
98 University of Texas at San Antonio
45%
99 Southern California Institute of Architecture
43%
100 University of Houston
43%
101 Florida A&M
42%
102 University of Nevada, Las Vegas
42%
103 The City College of New York
41%
104 Academy of Art University
39%
105 Woodbury University
32%
106 Howard University
32%
107 Florida International University
29%
| School | Pass Rate | |
|---|---|---|
| Princeton University | 81% | |
| University of Notre Dame | 77% | |
| University of Virginia | 77% | |
| Yale University | 77% | |
| MIT | 73% | |
| University of Washington | 73% | |
| University of Oregon | 72% | |
| Harvard University | 72% | |
| Virginia Tech | 71% | |
| Kent State University | 71% | |
| University Massachusetts Amherst | 71% | |
| Carnegie Mellon University | 70% | |
| Norwich University | 70% | |
| Portland State University | 70% | |
| University of Hartford | 70% | |
| University of Minnesota | 70% | |
| Rice University | 69% | |
| Tulane University | 69% | |
| University of Texas at Austin | 69% | |
| University of Cincinnati | 69% | |
| Judson University | 68% | |
| Montana State University | 68% | |
| Penn State | 67% | |
| Northeastern University | 67% | |
| University of Tennessee | 66% | |
| University of Colorado, Denver | 66% | |
| North Carolina State University | 65% | |
| Clemson University | 65% | |
| Ohio State University | 65% | |
| University of California, Berkeley | 65% | |
| University of Nebraska-Lincoln | 65% | |
| Cornell University | 64% | |
| Miami University | 64% | |
| Roger Williams University | 64% | |
| University of Colorado | 64% | |
| Washington State University | 64% | |
| Ball State University | 63% | |
| Texas A & M University | 63% | |
| University of Kansas | 63% | |
| University of Wisconsin-Milwaukee | 63% | |
| Iowa State University | 62% | |
| Louisiana State University | 62% | |
| University of North Carolina at Charlotte | 62% | |
| University at Buffalo, SUNY | 62% | |
| University of Illinois, Urbana-Champaign | 62% | |
| University of Michigan | 62% | |
| Cal Poly San Luis Obispo | 61% | |
| Rensselaer Polytechnic Institute | 61% | |
| Columbia University | 61% | |
| Kansas State University | 61% | |
| North Dakota State University | 61% | |
| University of Kentucky | 61% | |
| University of Idaho | 60% | |
| University of Utah | 59% | |
| Drury University | 58% | |
| Syracuse University | 58% | |
| University of Maryland | 58% | |
| Georgia Tech | 58% | |
| Washington University in St.Louis | 58% | |
| Rhode Island School of Design | 57% | |
| University of Arizona | 57% | |
| Lawrence Technological University | 57% | |
| University of California, Los Angeles | 57% | |
| University of Pennsylvania | 57% | |
| Catholic University | 56% | |
| University of Illinois at Chicago | 56% | |
| National Average | 55% | |
| University of Detroit - Mercy | 55% | |
| Wentworth Institute of Technology | 55% | |
| Frank Lloyd Wright School of Architecture | 54% | |
| School of Art Institute of Chicago | 54% | |
| Southern Illinois University Carbondale | 54% | |
| Temple University | 54% | |
| University of Southern California | 53% | |
| University of New Mexico | 53% | |
| Boston Architectural College | 52% | |
| Illinois Institute of Technology | 52% | |
| University of Louisiana at Lafayette | 52% | |
| Philadelphia University | 52% | |
| Andrews University | 51% | |
| Morgan State University | 51% | |
| University of Florida | 51% | |
| University of Miami | 50% | |
| University of Oklahoma | 50% | |
| Louisiana Tech University | 49% | |
| Texas Tech University | 49% | |
| California College of the Arts | 48% | |
| Arizona State University | 48% | |
| University of Hawaii at Manoa | 48% | |
| New Jersey Institute of Technology | 47% | |
| Pratt Institute | 47% | |
| Savannah College of Art and Design | 47% | |
| Cal State Pomona | 45% | |
| New School of Architecture and Design | 45% | |
| Southern Polytechnic State University | 45% | |
| University of South Florida | 45% | |
| University of Texas at Arlington | 45% | |
| University of Texas at San Antonio | 45% | |
| Southern California Institute of Architecture | 43% | |
| University of Houston | 43% | |
| Florida A&M | 42% | |
| University of Nevada, Las Vegas | 42% | |
| The City College of New York | 41% | |
| Academy of Art University | 39% | |
| Woodbury University | 32% | |
| Howard University | 32% | |
| Florida International University | 29% |
Methodology
I’m an architecture professor at Virginia Tech and teach ARE exam prep, so I’m by no means an objective independent third party. I very much have a “horse in this race.” While I have a math degree, no trained statisticians were used for this ranking and we make no claims of scientific validity. We simply culled data from publicly available sources, averaged it, and rank-ordered it.
All the data we used was pulled from NCARB’s ARE 5.0 Pass Rates by School website and inputted into this spreadsheet. If we’ve made an error while transcribing, let me know at mermann@vt.edu.
School licensure pass rates were based on the average pass rates for each of the six architecture licensure exams averaged over four years (2017, 2018, 2019, and 2020), so 24 cells in total (six exams times four years). If a school had, for instance, more alumni taking CE than PjM over those four years, or more taking exams in 2019 than 2020 (as most did because of COVID closures) our data would not have reflected that anomaly. We averaged the CE pass rates with the PjM pass rates (and all the others) and weighted each exam division and year as equal.
We used “missing teeth” in the data as a proxy for “a school is too small or too new to have useful data.” The vast majority of schools had data for each exam, each year. Those that didn’t were left off this survey. Below is an example of a program with a “full set of teeth,” included in our survey, and a program left out of the survey because of “missing teeth.”
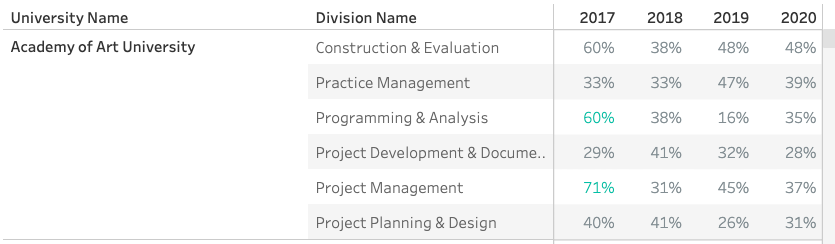

While NCARB has found that candidates with graduate degrees, on average, pass exams at a +4% rate relative to candidates with only undergraduate architecture degrees, the school-level data that NCARB provides for programs that offer both undergraduate and graduate degrees does not differentiate between the pass rates of the school’s undergraduates and graduates. Therefore, if a university offers both degrees, the overall pass rates for all degrees were reported in each list.
Only NAAB accredited programs were included in this ranking.